Update on Inflation and Inflation Expectations
Inflation is an important variable that investors and valuation professionals follow on a frequent basis. Inflation is important because it not only influences interest rates, but it also impacts the pricing of assets and the terms of long-term contracts. A high rate of inflation can extract a hefty toll on investments, eroding the purchasing power of the future dollars received. Low or moderate rates of inflation, particularly moderate expected rates, can help stimulate investment and economic activity.
With the U.S. Federal Reserve drastically expanding the monetary base, individuals, investors, and governments alike have become concerned with the prospect of higher inflation. Despite concerns, however, inflation expectations have remained within reasonable levels, and, although inflation expectations have risen in recent quarters, the projected rates of inflation remain relatively low.
In this article, I provide a brief overview of current inflation and inflation expectations. I will also decompose the current inflation rate to illustrate the primary sources driving the current inflation.
Current Inflation
During the 1st Quarter of 2013, the year-over-year increase in the U.S. Consumer Price Index (CPI-U) was 1.98 percent. Core-CPI inflation, which removes the volatile food and energy, increased at a year-over-year rate of 2.0 percent during the 1st Quarter of 2013. Exhibit 1 (below) presents recent trends in CPI and Core-CPI inflation.

Prior to the collapse of Lehman Brothers (near the 3rd quarter of 2008) CPI inflation was about 5 percent, with core-CPI inflation hovering around the 2.3-2.5 percent range. The financial crisis brought about a precipitous drop in the rate of non-core CPI inflation (largely a result of a wide-scale drops in asset prices), with core-CPI inflation exhibiting a modest downward trend from the Q3 2008 through Q4 2010.
Non-Core CPI inflation hit a record low (over the period analyzed) in Q2 2009, declining by 1.43 percent on a year-over-year basis. Non-core CPI inflation began a strong rebound from about Q3 2009 (deflation of 1.29 percent year-over-year) through Q3 2011, with year-over-year inflation at 3.87 percent. The rebound in price can, in part, be attributed to the fiscal and monetary stimulus of the U.S. Government and U.S. Federal Reserve, respectively.
After peaking in Q3-2011, non-core CPI inflation declined each quarter before reaching a low of 1.66 percent in Q2 2012. Since then, non-core CPI inflation has increased slightly, but has stayed within a range of about 1.75 to 2.0 percent.
Core-CPI inflation witnessed a pickup after Q3-2010 through Q1-2012, with the year-over-year rate of core inflation rising from 0.8 percent to 2.26 percent. The rate of core inflation has fluctuated within a range of about 1.90 to 2.25 percent since Q1 – 2012, in-line with the Fed’s target.
Since Q3 2013, both core and non-core CPI have been modest and relatively in line with each other. The data suggest that current rates of inflation have moderated at about the 2.0 percent level.
Also, a noticeable observation in the data is the dramatic reduction in inflation volatility. Generally speaking, the Federal Reserve has, in my opinion, done a good job of stabilizing the price level, despite the rapid growth in the monetary aggregates over this period.
Short-Term Inflation Expectations
Short-term inflation expectations, defined as the rate of expected inflation in the U.S. CPI over the next 1-5 years, have appeared to increase during Q1 2013 vs. Q4 2012 (based upon breakeven estimates from the U.S. Treasury Market).
As of Q1 2013, market participants are pricing in a break-even inflation rate of about 2.3 percent over the next year, slightly above the 1.98 percent rate realized on a year-over year basis during Q1 2013. One year breakeven inflation was about 1.3 percent during Q4 2012 and 2.18 percent one year ago. Five year break-even expectations have also blipped up slightly during the Q1 2013, with the breakeven inflation rate rising from 2.07 percent to 2.33 percent.
Overall, short-term inflation expectations have increased during the Q1 2013, but are generally in-line with recent realized rates of inflation. Market participants are currently pricing in moderate rates of inflation over the next 1-5 years, with the expected rate remaining fairly stable at about 2.3 percent over the entire period. These rates are slightly higher than the Fed’s target of 2.0 percent.
Long-Term Inflation Expectations
Long term inflation expectations, defined as inflation expectations over the next 10 and 20 years have also crept up during Q1 2013, but only slightly. The 10 year breakeven inflation rate is approximately 2.52 percent, compared to 2.45 percent during Q4-2012, and 2.34 percent one-year ago. The 20 year break-even inflation rate is about 2.49 percent, compared to 2.45 percent during Q4-2012 and 2.42 percent one year-ago. Overall, long-term inflation estimates are moderate.
The chart below illustrates the term structure of U.S. breakeven inflation expectations, as measured by the U.S. Treasury Market.

As shown, inflation expectations have crept up at the short-end of the term structure relative to Q4 2012. Today, however, the term structure is relatively flat, suggesting that the market anticipates a moderate rate of inflation in the 2.3-2.5 percent range over the next 20 years. In my opinion, the stability in inflation, as evidenced by the flatness of the inflation term structure, is a positive development; that is, long-term inflation expectations are stabilizing, suggesting less inflation uncertainty over the long-term.
Decomposition of Inflation Using the Quantity Theory of Money
The quantity theory of money is a mathematical identify that relates the realized inflation rate to the growth rate in the money supply, the growth rate in the velocity of money, and the growth rate in real GDP. The theory states the following
Inflation Rate = %Chg. Money Supply + %Chg. Velocity of Money – % Chg. In Real GDP
The velocity of money is the average frequency with which a unit of money is spent on new goods and services produced domestically in a specific period of time. It can be viewed as the amount of economic activity associated with a given money supply. It is defined as the ratio of nominal GDP divided by the money supply. The table below decomposes recent inflation rate using the quantity theory of money. Please note that the inflation rates reported below differ from the CPI inflation rates reported above because these rates are based upon the GDP Deflator (an alternative measure of inflation) and are reflected as a continuous rate of inflation. The rates are also seasonally adjusted rates. The differences, however, do not affect the purpose of the analysis, which is to understand the drivers of recent inflation.
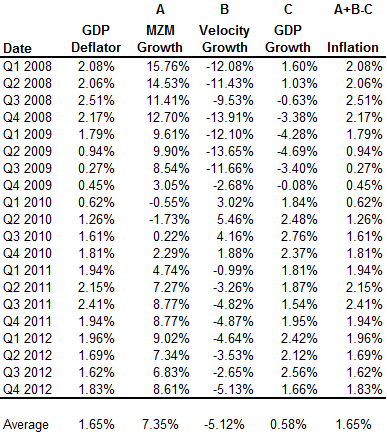
In 2008, the year-over-year change in inflation (as measured by the continuously compounded change in the GDP deflator) ranged about 2.0-2.5 percent. Most of the monetary inflation during this period was fueled by a rapid expansion in the money supply, which was heavily offset, however, by significant declines in the velocity of money. In the early parts of 2008, real GDP growth also helped reduce inflation fueled by the expansion of money, but as real GDP declined in Q3 and Q4 it actually boosted the inflation rate slightly.
In 2009, inflation dropped significantly, with the year-over-year inflation rate ranging from about 1.8 percent to 0.27 percent. The drop in inflation during this period was largely a function of a slower expansion in the U.S. money supply, followed by large drops in the velocity money. In other words, as the financial crisis unfolded, the amount of economic activity declined considerably, thereby placing pressure on the price level given the outstanding stock of money. The decline in real GDP also contributed to the inflation rate.
Inflation picked up strongly in 2010 relative to 2009. The pick-up in inflation was a surge in the velocity of money during this period. Real GDP growth also expanded sharply, which held the inflation rate back somewhat. Monetary growth over this period was not significant.
In 2011, the money supply started to expand again, primarily as a result of QE2, which boosted the rate of inflation. The monetary expansion, however, was partially offset by the velocity of money, which remained negative all throughout 2011. Real GDP growth was also somewhat sluggish during this period, which contributed to inflation over the period.
In 2012, inflation declined relative to 2011. This decline was primarily a result of strong real GDP growth, slower monetary expansion, and continued declines in the velocity of money.
It should be evident that over this entire period that the money supply increased rapidly, but this monetary expansion did not result in a high level of inflation because of a precipitous decline in the velocity of money. Indeed, although the average year-over-year change in the money supply was about 7.4 percent since Q1 2008, velocity declined on average at about 5.1 percent. Real GDP expanded at an average year-over-year rate of only about 0.60 percent, which also reduced the inflation rate.
Reconciling & Projecting Inflation: Quantity Theory of Money,
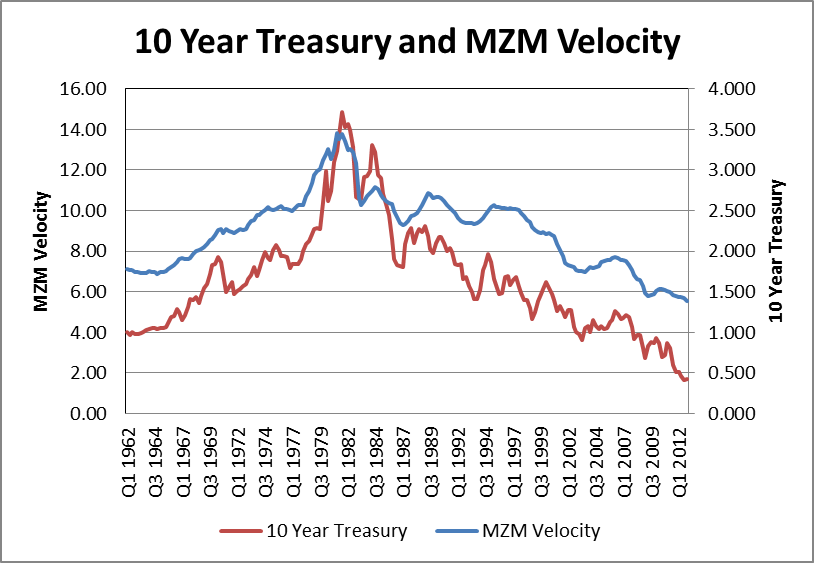
U.S. Economists project that real GDP will increase at an annualized rate of 1.9 percent, 2.8 percent, and 2.9 percent, and 3.0 percent for the years 2013, 2014, 2015, and 2016, respectively (based upon the Q1-2013 Survey of Professional Forecasters). The Federal Reserve is currently purchasing approximately $1 trillion in mortgage backed securities and treasury bonds per annum, representing about an 8-9 percent growth rate in the money supply. These factors would suggest about a 6-7 percent inflation rate, ignoring changes in the velocity of money. Since current inflation expectations, however, are settled around 2-2.5 percent, market participants are expecting continued declines in the velocity of money at the rate of about 4-5 percent per annum. Currently, MZM velocity, much like the 10 year treasury yield, is at historically lows levels (see chart below).
It should be evident that an unexpected rise in the velocity of money could result in an unexpected increase in the rate of inflation. However, so long as MZM velocity continues to decline, we should expect the inflation rate to remain low.
Conclusions
Overall, U.S. inflation expectations remain within reasonable levels. Although the U.S. monetary supply has increased rapidly over this period, declines in MZM velocity have largely offset the increase in the money supply, a situation that has kept the inflation rate low. Both short-term and long-term inflation expectations are strongly grounded at the 2-2.5 percent level. Much of the low inflation appears to a result of continuing expectations regarding a continued decline in the velocity of money. So long as MZM velocity does not unexpectedly pick up significantly, inflation should remain within reasonable levels over the short-run.
